
We've written about building an AI-native investment process, and there is plenty left to cover. One question kept nagging at us, though. Assume the process gets built perfectly. Is it just an efficiency tool, or can it actually help investors make better calls?
Starting today, before each S&P 500 company reports, four leading models and Implied will make the same set of calls: the three KPIs most likely to move the stock, whether each lands above, below, or in line with consensus, the guidance that matters, and day-one and day-five idiosyncratic returns. Each forecast is generated the day before the company reports, then scored against the reported numbers and the stock’s subsequent move.
We want to answer three questions. Can any system beat a coin flip on calling earnings outcomes? Does a research process built for investing improve the call? And when Implied studies its misses each Friday, does the following week get better?
Why Earnings?
Predicting a quarter is a hard task, even for a human. Investors have more data than ever, yet earnings-day moves are near their highest levels in over a decade.
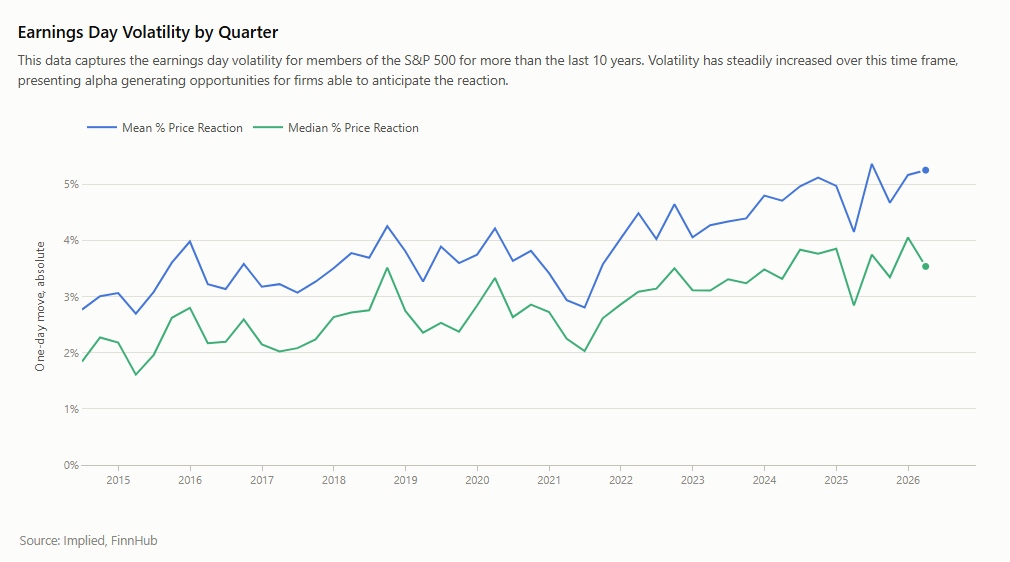
Why is it so hard? Because it is really two separate predictions, each with its own challenges.
The first is the fundamentals: will the company beat or miss on the metrics that matter, and will guidance come in above or below expectations? The hardest part here is knowing which KPIs matter in the first place. A stock can trade on subscriber growth for years, then wake up caring about margins.
The second is even harder: what the stock does once the numbers are out. The reaction is not about the results alone. You have to know buy-side expectations and positioning, neither of which is easily estimable. And it can turn on things you simply cannot predict: a surprise announcement on the call, a macro headline that same day that changes the fundamental picture, a peer's print the night before.
Of course, calling earnings outcomes does not come close to covering everything investor judgment does. But in our view it is a good first test for AI. The predictions are measurable, and despite all the data thrown at the problem, there is more alpha around earnings than ever. We do not know what the results will show. That is the point of the experiment, and we will share all of it in public.
Design Methodology
The experiment is set up to answer those three questions at once.
Our setup puts four frontier models – GPT-5.6 Sol and GPT-5.6 Terra from OpenAI and Opus-4.8 and Sonnet-5 from Anthropic – against the Implied platform. Each day at 5PM PDT, an automated pipeline pulls the following day’s S&P 500 reporters from our events calendar. Using those tickers, each model is asked to produce two deliverables.
The first deliverable is a free-form earnings preview. The structure is deliberately unprescribed at this step. We want to see what each model will prioritize in an earnings preview, since what matters going into a print is part of the test.
The second deliverable receives the earnings preview as part of its input, and asks for a fixed-schema forecast of three things:
- The three KPIs most likely to move the stock, each labeled BEAT / MISS / IN-LINE against consensus, with a ±1% threshold
- The guidance items that will matter, each labeled BETTER / WORSE / UNCHANGED / UNKNOWN against consensus for the stated period
- Day-1 and day-5 idiosyncratic return (stock − beta × S&P 500), as an exact percentage
To give the baseline models access to the core information they need, we built a small MCP server around three internal tools: public financial documents, daily news from approved sources, and historical prices. Each model can also use its vendor’s native web search without restriction.
These tools are deliberately thin, while still ensuring the base models have access to the same public information as Implied. The delta we are measuring is Implied’s harness – platform scaffolding, domain knowledge, advanced skill files that base models lack on their own.
Each model’s run saves the timestamped deliverables, along with a transcript file showing all tool calls used, and a metadata file showing model, speed, tokens used, and cost.
Deliverable 1 — C Q2 2026 Earnings Preview
Deliverable 2 — C Q2 2026 Forecast
Scoring
Some of this grading requires judgment. A stock does not publish an answer key explaining which KPI drove the move, and there is no perfectly objective way to decide whether the model selected the metrics that mattered most. We will use a consistent rubric, publish our reasoning on ambiguous cases, and keep the underlying forecasts visible so readers can disagree with a grade.
We will separate diagnostic scores from performance scores. KPI and guidance accuracy tells us where the research was right or wrong. Each report and guidance prediction will receive a true or false grade. A selected KPI that proves immaterial or is not resolved by the print counts as false, and the same applies to predicting guidance that the company does not provide. This deliberately combines KPI selection and prediction in one score. Choosing what to forecast is part of the task, and a system should not receive credit for correctly predicting a metric that had negligible impact on the result.
Day-one and day-five idiosyncratic returns provide the cleaner test: did the system call the stock reaction correctly? Each forecast will receive a true or false score depending on whether it gets the direction of the stock move correct. Because every system predicts an exact return as part of its second deliverable, we will publish those.
At the end of each week, we will publish a scoreboard per model with report accuracy, guide accuracy, and day-one and day-five direction hit rates.
Weekly Improvement
The part we’re most excited about is diagnosing the misses each week. Was it a data problem, a domain convention, or a materiality call it got wrong? Is it a problem we can improve by giving it more context?
Every Friday, we will go through the weekly results and look for any failure patterns. By saving a full tool-call transcript of each model, it’s easy to replay exactly what happened. Each miss gets a diagnosis: trace the transcript file, find what went wrong, name the cause. As misses accumulate, we expect to find patterns, and will publish a taxonomy alongside examples as it emerges.
Diagnoses become context for next week's prints. Some of that will be a human in the loop, reading the trace, identifying the gap, and encoding the fix as a skill revision or new piece of domain knowledge. Some of it the Implied platform does itself, proposing skill improvements when given the miss and the trace. Much as a human analyst learns each quarter, the system should be able to take what it learned and apply it to the next print.
Each week, we’ll publish the model scoreboard along with any changes we’ve made. The baseline models will run the same prompts all season, while the Implied platform will compound as it learns. Measuring that asymmetry is the experiment. If the hypothesis holds, we expect the gap between base models and Implied to widen as the season goes on.
Instead of yet another benchmark, we are putting Implied to the test in a live experiment, with the market as the judge. We do not know how close AI is to being able to call earnings outcomes. That is why the market gets to grade it. Previews start with this week's prints, and we publish the first scoreboard Friday.