
Last week, we began testing whether leading AI models and Implied could predict earnings outcomes before they happened.
The first results are in.
Week 1 Direction Accuracy
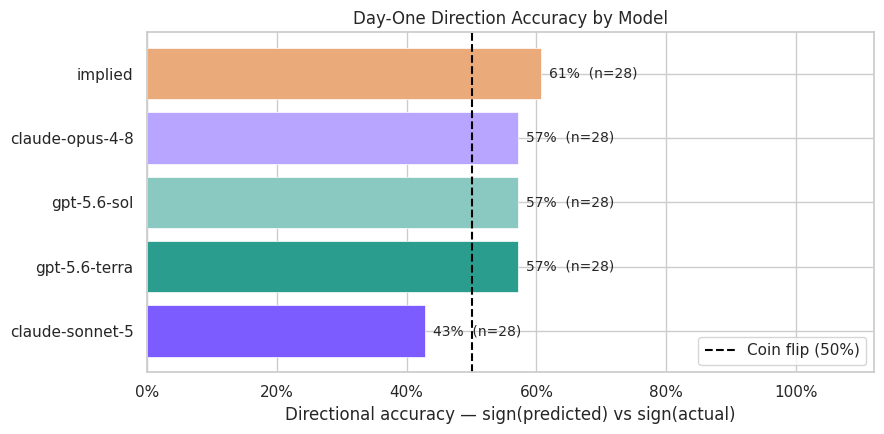
Direction accuracy is our primary measure. It answers the simplest and most important question: did the model correctly predict whether the stock would go up or down?
Across 28 companies, Implied correctly predicted 17 day-one stock moves, finishing Week 1 at 60.7% direction accuracy. GPT-5.6 Terra, GPT-5.6 Sol, and Claude Opus 4.8 each finished at 57.1%, while Claude Sonnet 5 finished at 42.9%.
The difference between Implied and the second place models is one correct call. That makes the result interesting, but far from conclusive. Twenty-eight observations are far too few to establish that any system is consistently outperforming chance.
Accounting for Magnitude
Direction accuracy is our primary measure, but it captures only whether the predicted direction was correct. A forecast of a 0.5% increase and a forecast of a 4% increase both count as correct if the stock rises 5%, even though the second prediction was substantially closer.
There is no single correct way to measure magnitude accuracy. Any method requires choices about how to compare small and large moves, penalize overestimates and underestimates, and balance direction against magnitude. We chose a method that is simple, transparent, and treats direction as the primary result while using magnitude as a secondary measure of forecast quality.
Our approach evaluates magnitude only after a prediction gets the direction right. Within that set of correct-direction calls, we compare the predicted and actual move sizes using a simple ratio we call magnitude similarity.
Let:
- $P_i$ be the predicted percentage move for company $i$
- $a_i$ be the actual percentage move
- $C$ be the set of predictions with the correct direction
For each prediction in $C$, magnitude similarity is:
$$ S_i = \frac{\min(|P_i|, |a_i|)}{\max(|P_i|, |a_i|)} $$The score ranges from 0 to 1. An exact magnitude prediction scores 1, while increasingly large differences between the predicted and actual moves push the score toward 0.
For example:
- Predict 4%, actual 5%: $S_i = 4/5 = 0.8$
- Predict 0.5%, actual 5%: $S_i = 0.5/5 = 0.1$
The measure is proportionally symmetric. Predicting half the realized move and predicting twice the realized move both score 0.50. Once direction is correct, overshooting and undershooting by the same multiple receive the same penalty.
Weighting Larger Moves
We then calculate an actual-move-weighted average of these scores:
$$ M = \frac{\sum_{i \in C} |a_i| S_i}{\sum_{i \in C} |a_i|} $$Weighting by $|a_i|$ prevents a well-predicted 0.3% move from counting as much as a well-predicted 8% earnings reaction. Larger realized moves therefore contribute more to the magnitude score.
Like the individual similarity scores, $M$ ranges from 0 to 1. Importantly, it measures magnitude quality only among correct-direction calls. Wrong-direction predictions do not enter this average; they are penalized through direction accuracy.
We then average those scores across correct-direction calls, giving more weight to larger actual stock moves.
Combining Direction and Magnitude
$$ \text{Combined Score} = 100 \times \text{Direction Accuracy}^2 \times M $$Squaring direction accuracy is intentional, and gives directional correctness additional weight. Direction remains the dominant component, while magnitude helps differentiate models with similar directional accuracy. For example, a decline from 90% to 80% direction accuracy reduces the direction component from $0.90^2 = 0.81$ to $0.80^2 = 0.64$, a 21% decline.
Multiplying by 100 scales the result to a 0–100 range. The result is an index, not an accuracy percentage.
This construction makes it difficult to score well through magnitude accuracy alone. A model must first get a substantial share of directions right; magnitude then differentiates between models based on how closely they estimated the size of their correct calls.
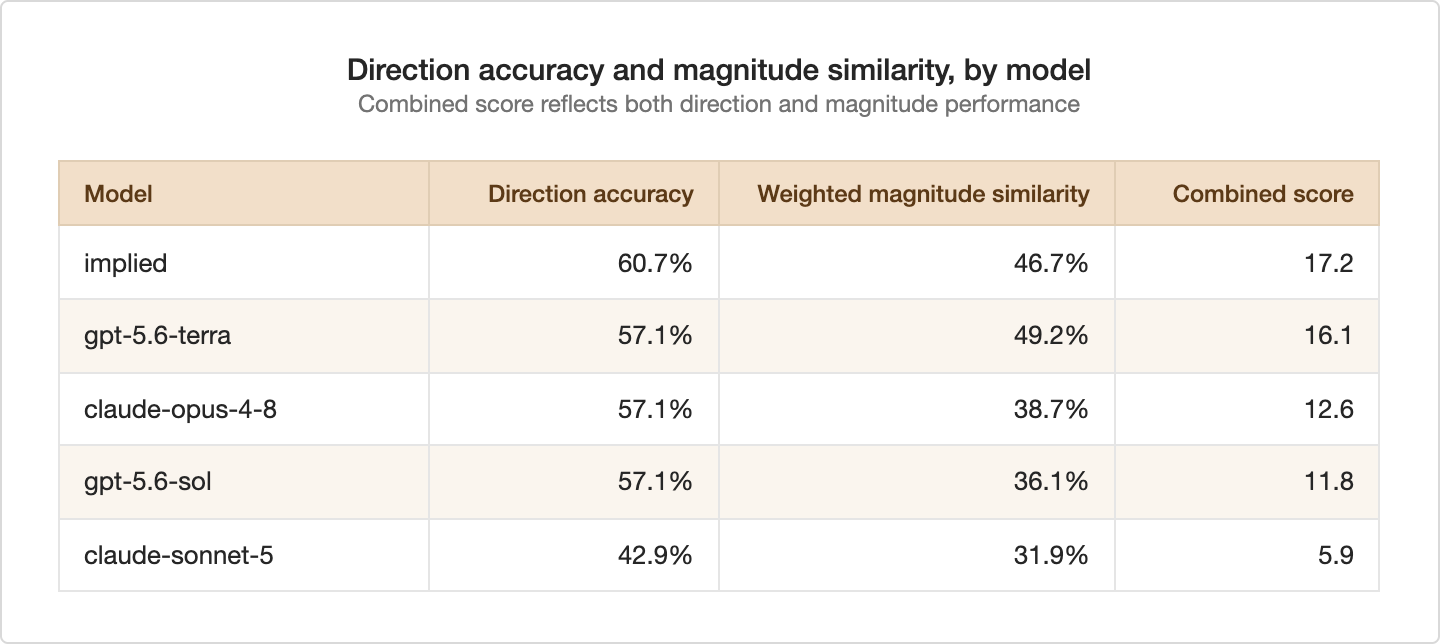
Terra had the highest magnitude similarity, but Implied finished first overall because it correctly predicted one additional stock direction. Opus, Sol, and Terra had identical direction accuracy, so magnitude separated their combined scores.
Sonnet was notably weaker on both measures, producing a combined score roughly one-third of Implied’s.
Did the Models Predict the Fundamentals?
We also evaluated whether the models correctly predicted reported KPIs and guidance. This introduces another challenge: determining what was important is inherently subjective.
It is relatively easy to confirm whether a KPI beat or missed consensus, but much harder to determine whether that KPI actually mattered to the stock. A model could correctly predict an immaterial metric, or identify the likely driver only for the stock to react to an unexpected announcement.
For each item a model predicted, we asked whether the outcome occurred. If the company did not report or discuss the predicted KPI, we graded the call as incorrect rather than removing it from the evaluation. This penalizes models for making irrelevant or unverifiable calls.
For now, these results answer a narrower question: Did the predicted outcome happen? They should be read as outcome hit rates, not as a complete measure of whether the model selected the KPIs that ultimately mattered most.
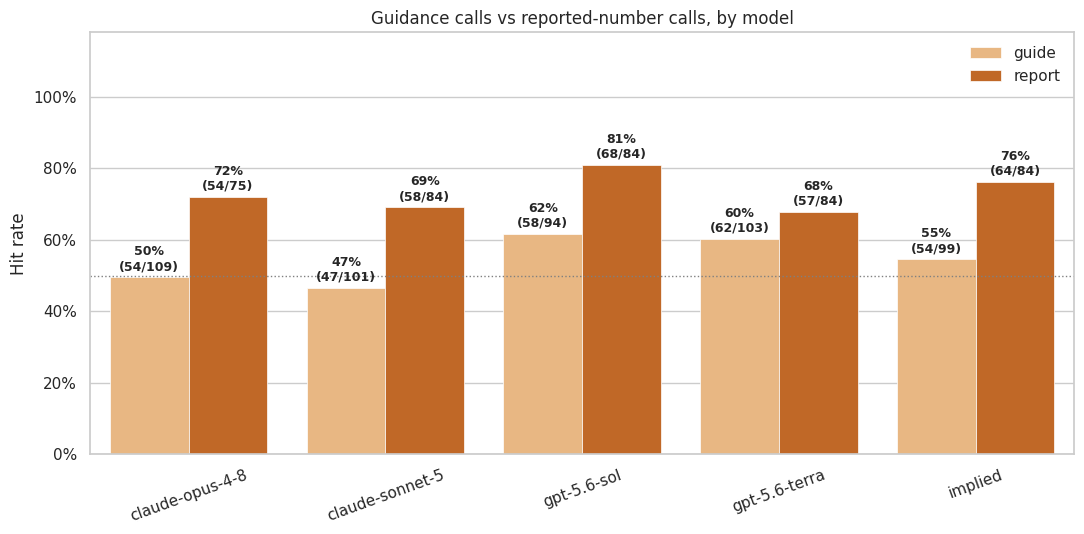
We will continue refining a consistent framework for evaluating materiality. For now, readers can review the underlying predictions and grades and assess each call in context.
What the Scores Do Not Capture
We made several early observations that are not reflected in the headline scores.
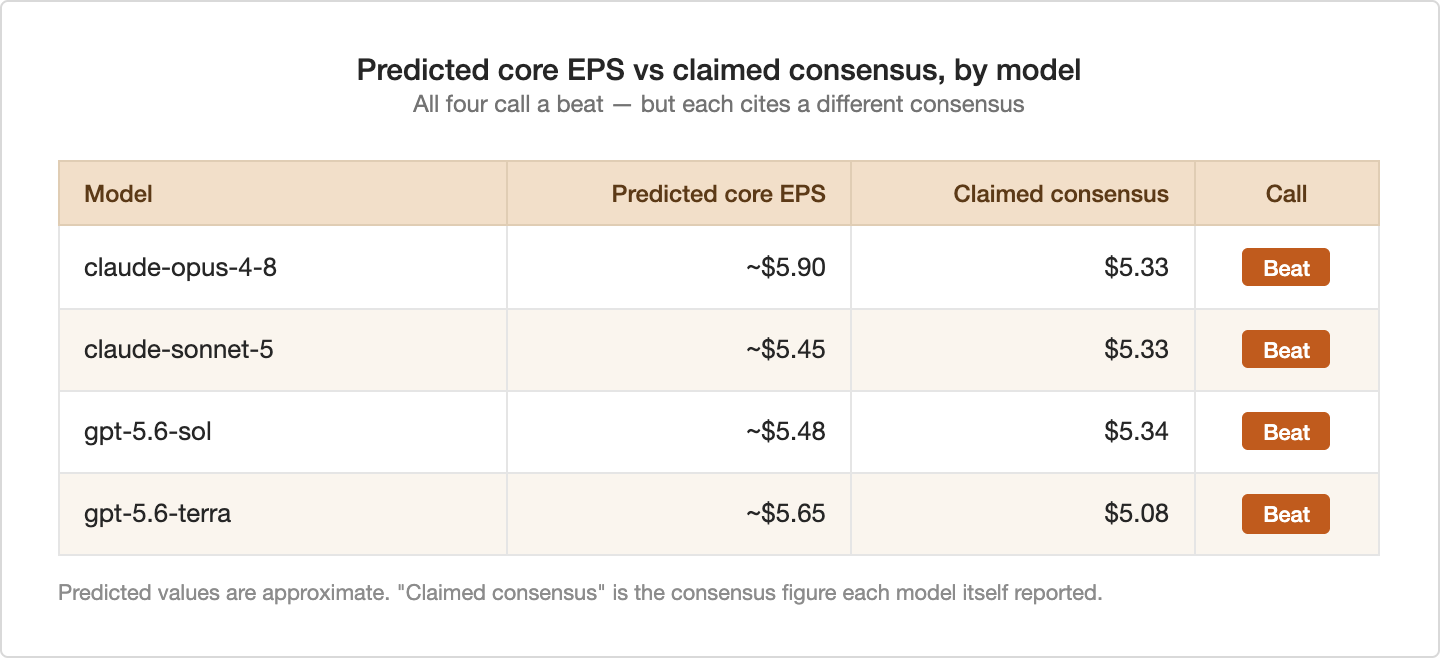
First, all base models showed some hallucination. For example, none had access to line-item consensus, yet nearly all produced specific estimates. For TRV, the models cited Core EPS consensus ranging from $5.08 to $5.34, despite those figures not being available through their tools.
KPI selection also exposed differences in domain understanding. For BAC, Implied selected Operating EPS, while the base models chose Diluted EPS or generic EPS - less relevant measures of underlying performance.
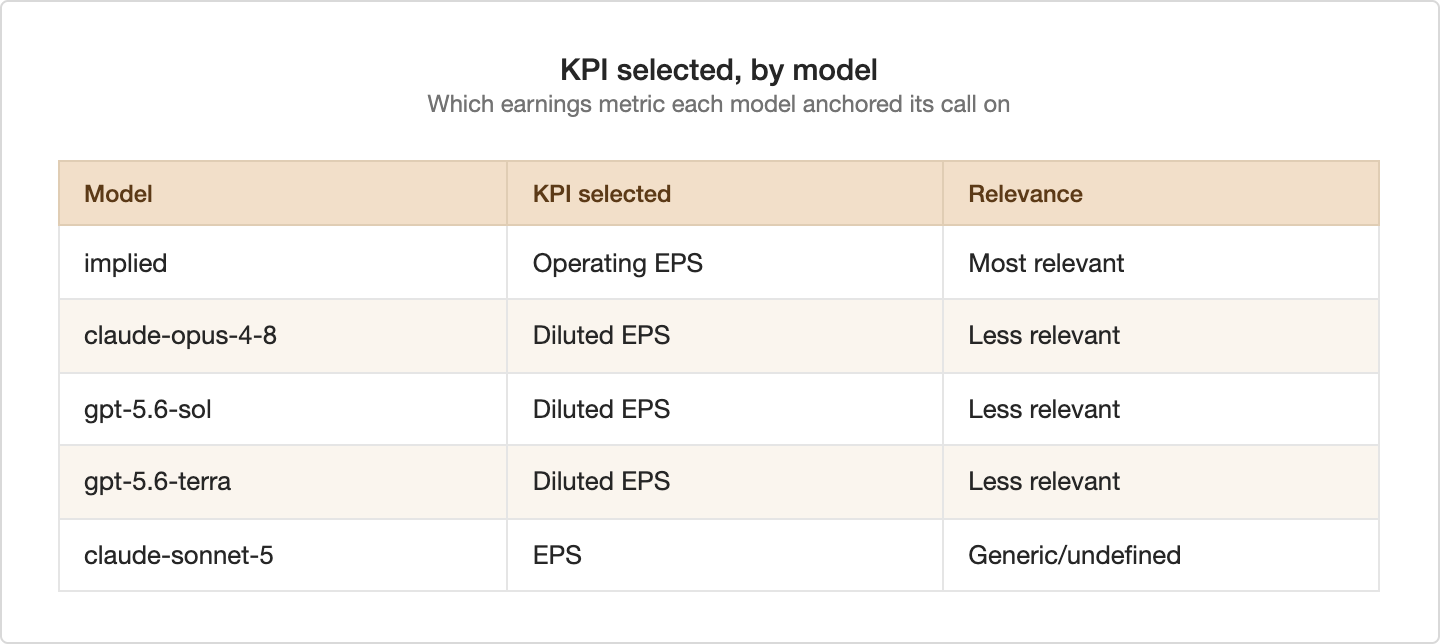
A model can therefore reach the right conclusion using unsupported data or by focusing on the wrong metric. The company-level forecasts let readers evaluate the reasoning behind each call, not just the outcome.
What Changes Next Week
Week 1 showed an early spread among models operating with the same prompts and tools. In Week 2, we will test model choice inside Implied more directly.
We will vary only Implied’s primary reasoning model while holding its research process, data, tools, prompts, and supporting components constant. This controlled comparison should help isolate how much performance comes from the reasoning model itself versus Implied’s investing-specific system and domain knowledge.
The standalone models will continue running with the same prompts and tools, preserving the baseline comparison.
Week 1 is only a starting point. The more important test is whether the early results persist as the sample size grows, and how much the choice of reasoning model changes them.
Explore the Full Results
Every company-level prediction and grade is available for review. View the full results here.