Week 2 of earnings has wrapped up, adding 83 new predictions for each model. We now have results for 111 companies across the first two weeks of the experiment.
Week 2 Direction Accuracy
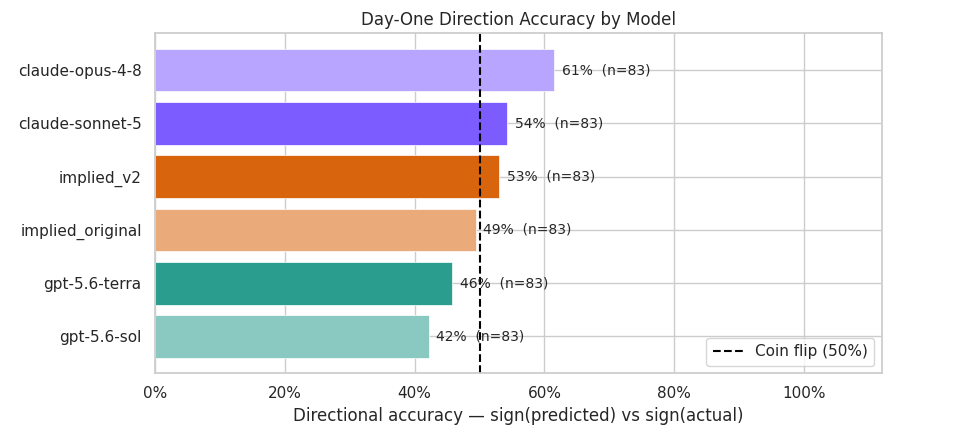
Claude Opus 4.8 led Week 2 and was the only model to finish meaningfully above the 50% coin-flip line. Implied V2 finished slightly above 50%, while Implied Original and both GPT-5.6 models finished below it.
Direction and Magnitude
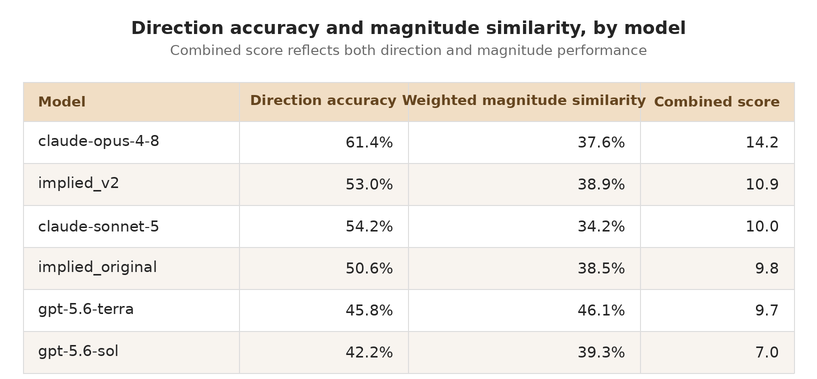
Opus also led the combined score. Implied V2 finished second overall.
GPT-5.6 Terra had the highest magnitude similarity among its correct-direction calls, but its lower direction accuracy pulled it down in the combined ranking.
Predicting Reported Results and Guidance
We again evaluated whether the models correctly predicted reported KPIs and guidance.
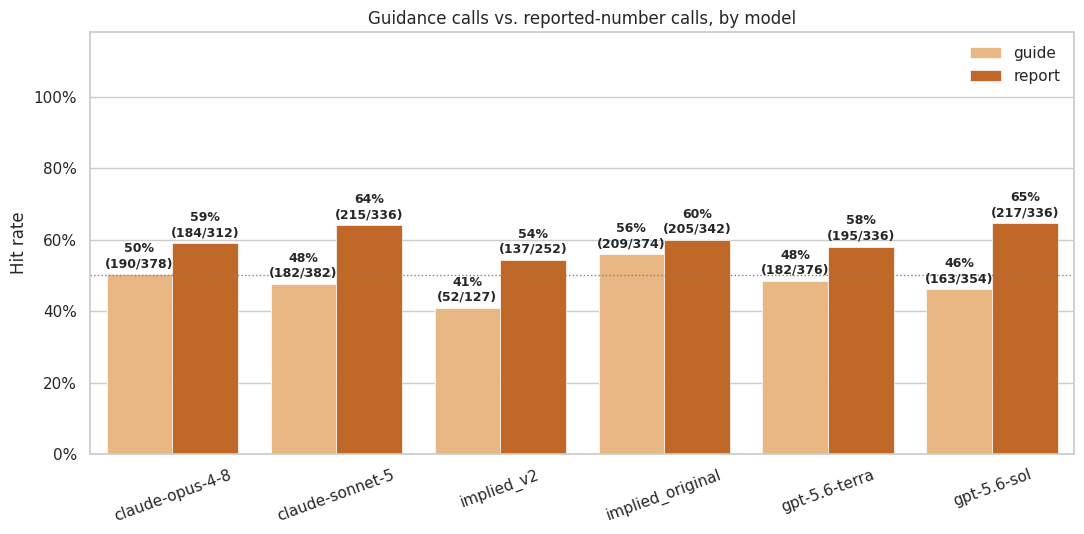
Two observations stood out. First, reported results were generally easier to predict than guidance. Second, there was no clear relationship between correctly predicting guidance and correctly predicting the stock’s direction.
It is important to remember that these hit rates measure only whether a predicted outcome occurred. They do not show whether it mattered to the stock or whether the prediction relied on valid data. We again saw base models cite consensus figures that were not available through their tools.
Implied V2 returned “unknown” for many guidance predictions, reducing the number of gradable calls and affecting the comparison. Next week, we will require every model to make an explicit guidance prediction.
Cumulative Results
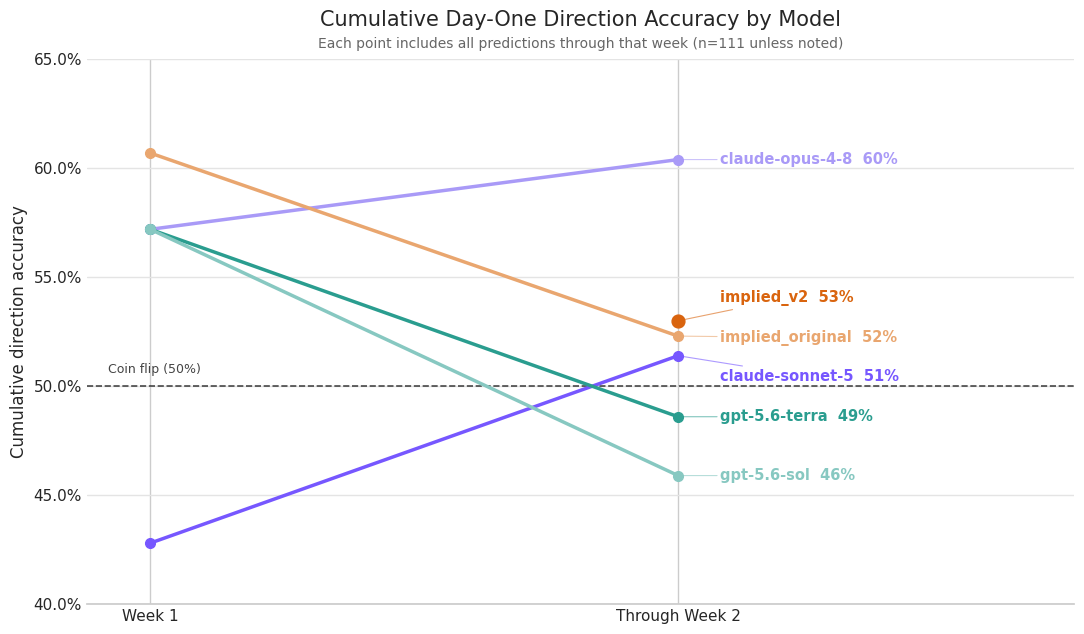
Performance diverged meaningfully in Week 2. Both Claude models improved, while GPT-5.6 Terra, GPT-5.6 Sol, and Implied Original declined, with the sharpest deterioration among the two GPT models. Implied V2 was introduced in Week 2, so it does not yet have a prior-week comparison.
The cumulative results provide a more useful view than either week alone, although 111 companies remain too small a sample to draw firm conclusions about sustained performance.
What Changed Inside Implied
We continued running the version of Implied used in Week 1, now labeled Implied Original. We also introduced Implied V2, which adds another reasoning layer before making the final prediction.
We were not sure how much this would change the results. Our hypothesis was that the additional reasoning layer would help the system weigh the different factors that could influence a stock’s reaction and produce better forecasts.
V2 did perform better than Implied Original, but the improvement was modest. What surprised us was how it got there: Implied V2 was by far the most pessimistic model.
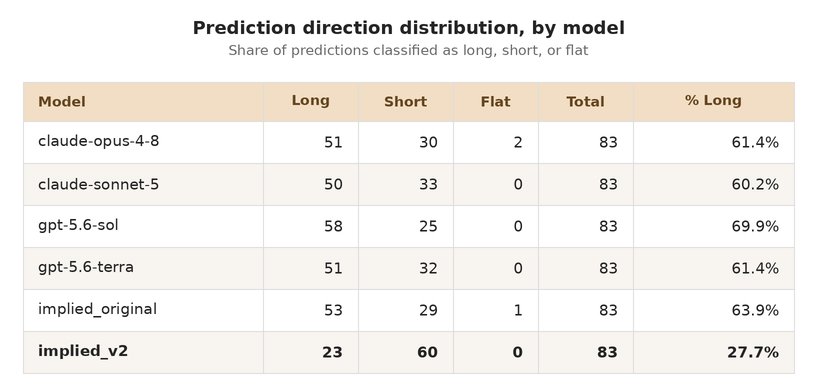
Implied V2 was the only model to predict substantially more negative moves than positive ones, while every other model leaned meaningfully bullish.
Despite this bearish skew, Implied V2 finished second on the combined score. It is too early to know whether this reflects useful skepticism, a favorable match with this week’s earnings environment, or a systematic bias.
What We Plan to Change Next Week
We saw several interesting changes in Week 2, but nothing systematic enough to warrant restructuring the prompts or methodology. We are making two smaller refinements to keep every prediction explicit and gradeable.
First, models will no longer be allowed to predict a one-day return of exactly 0%. Each model must make a directional call.
Second, “unknown” will no longer be accepted as a guidance prediction. Models must make a specific, falsifiable prediction, including explicitly predicting that a company will not provide guidance when appropriate.
Week 2 belongs to Opus, but the rankings are already shifting as the sample grows. We will continue publishing both weekly and cumulative results throughout this earnings season.
Explore the Full Results
Every company-level prediction and grade is available for review. View the full results here.