Week 3 of earnings has wrapped up, adding 167 new predictions for each model. We now have results for 278 companies across the first three weeks of the experiment.
Week 3 Direction Accuracy
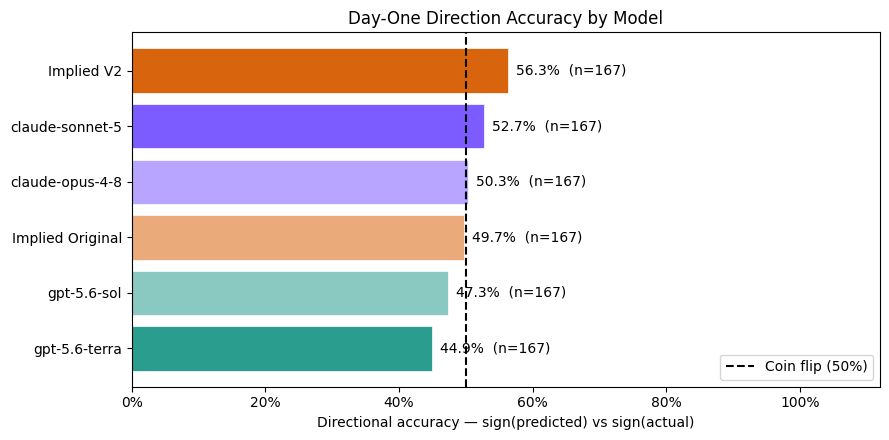
Implied V2 led Week 3 with 56.3% direction accuracy, followed by Claude Sonnet 5 at 52.7%. Claude Opus 4.8 finished almost exactly at the 50% coin-flip line, while Implied Original and both GPT-5.6 models finished below it.
Overall direction accuracy fell meaningfully this week. One possible explanation is the unusually active market environment, which included a Federal Reserve decision and a sharp factor rotation, particularly in momentum stocks. These events may have influenced some day-one moves, making them less directly attributable to company results.
That is an unavoidable limitation of evaluating earnings predictions using day-one returns, but it was likely more significant this week than in the first two.
Direction and Magnitude
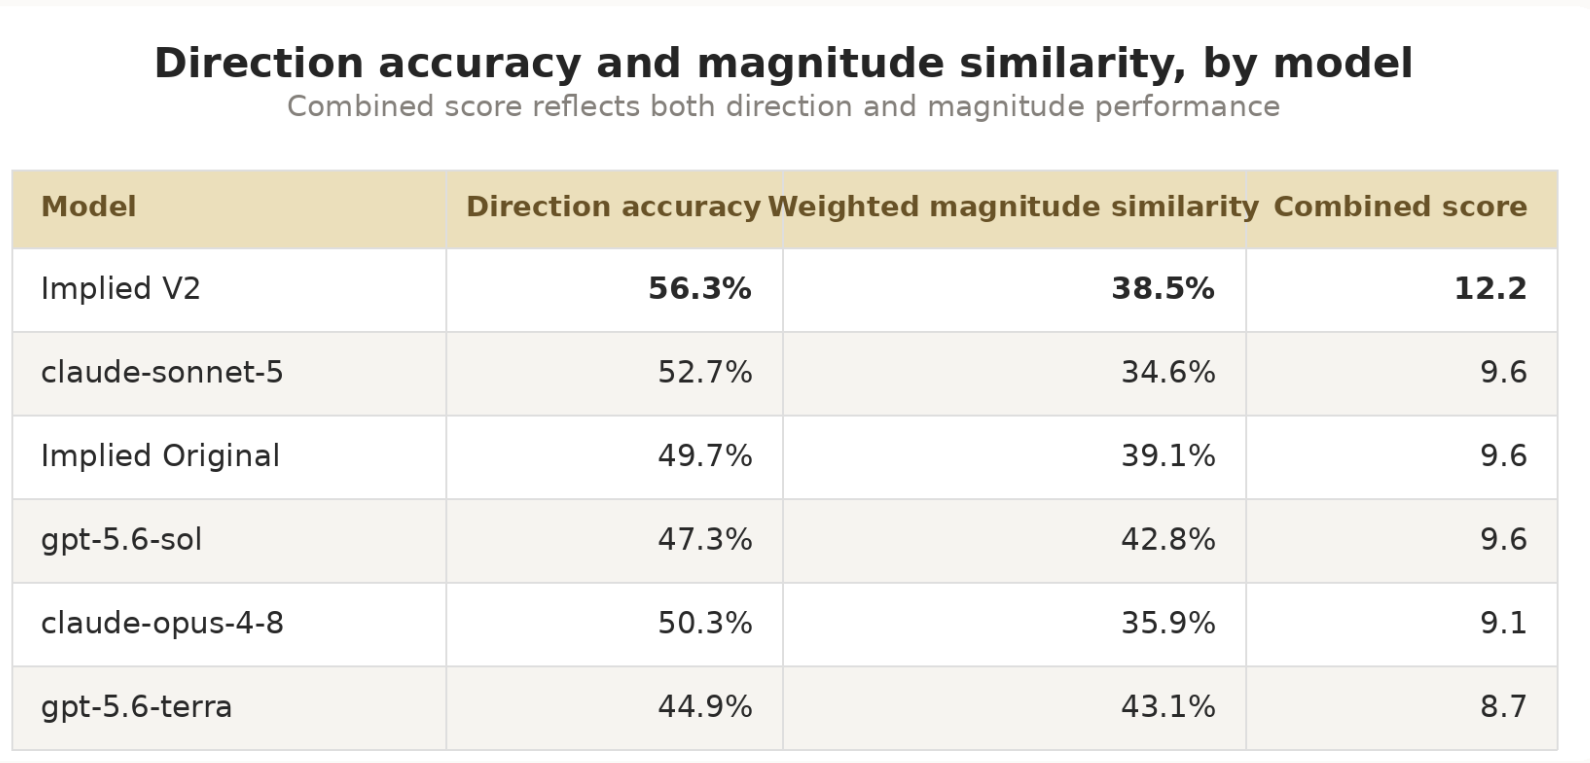
Implied V2 also led the combined score at 12.2, compared with 9.6 for the next three models.
Direction accuracy and magnitude similarity were not closely related. GPT-5.6 Terra had the highest magnitude similarity among its correct-direction calls, yet it had the lowest overall direction accuracy at 44.9%. Implied V2, meanwhile, led direction accuracy without leading on magnitude.
This reinforces the importance of evaluating the two separately. Predicting the size of a move when the direction is correct is different from consistently predicting the direction itself.
Predicting Reported Results and Guidance
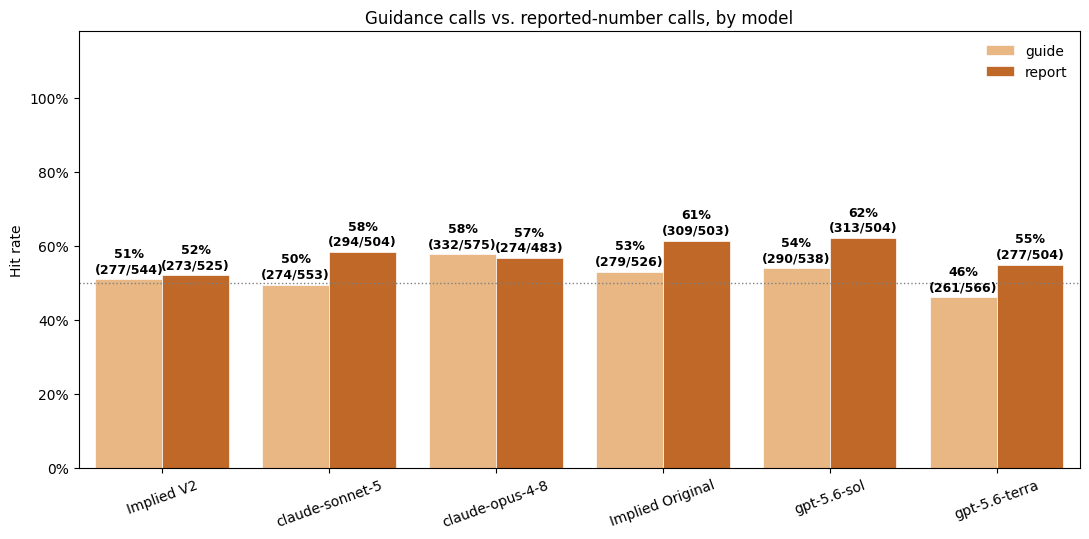
Consistent with the first two weeks, we found no clear relationship between correctly predicting reported results or guidance and correctly predicting the stock’s direction.
GPT-5.6 Sol had the highest reported-number hit rate at 62%, despite finishing below 50% on direction accuracy. Implied V2 led direction accuracy but was closer to the middle of the group on both reported results and guidance.
These hit rates measure only whether the predicted outcomes occurred. They do not tell us whether those outcomes were the metrics investors cared about most or whether they drove the stock’s reaction. The heavier influence of macro events this week may have further weakened the relationship.
Cumulative Results
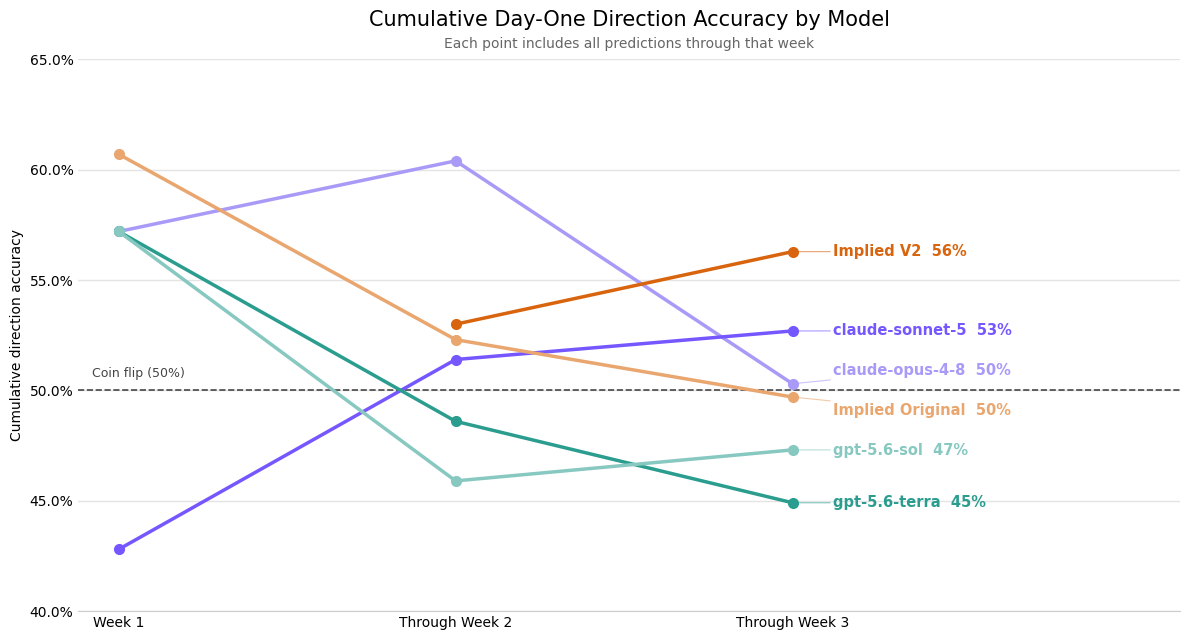
Week 3 materially changed the cumulative standings. Implied V2 moved into the lead, while Claude Opus gave back much of the advantage it built in Week 2. The rankings have now shifted meaningfully in each of the first three weeks.
The cumulative results remain more informative than any individual week, but 278 companies are still too small a sample to draw firm conclusions about sustained performance.
What Stood Out Inside Implied
Implied V2’s negative tilt became even more extreme this week.
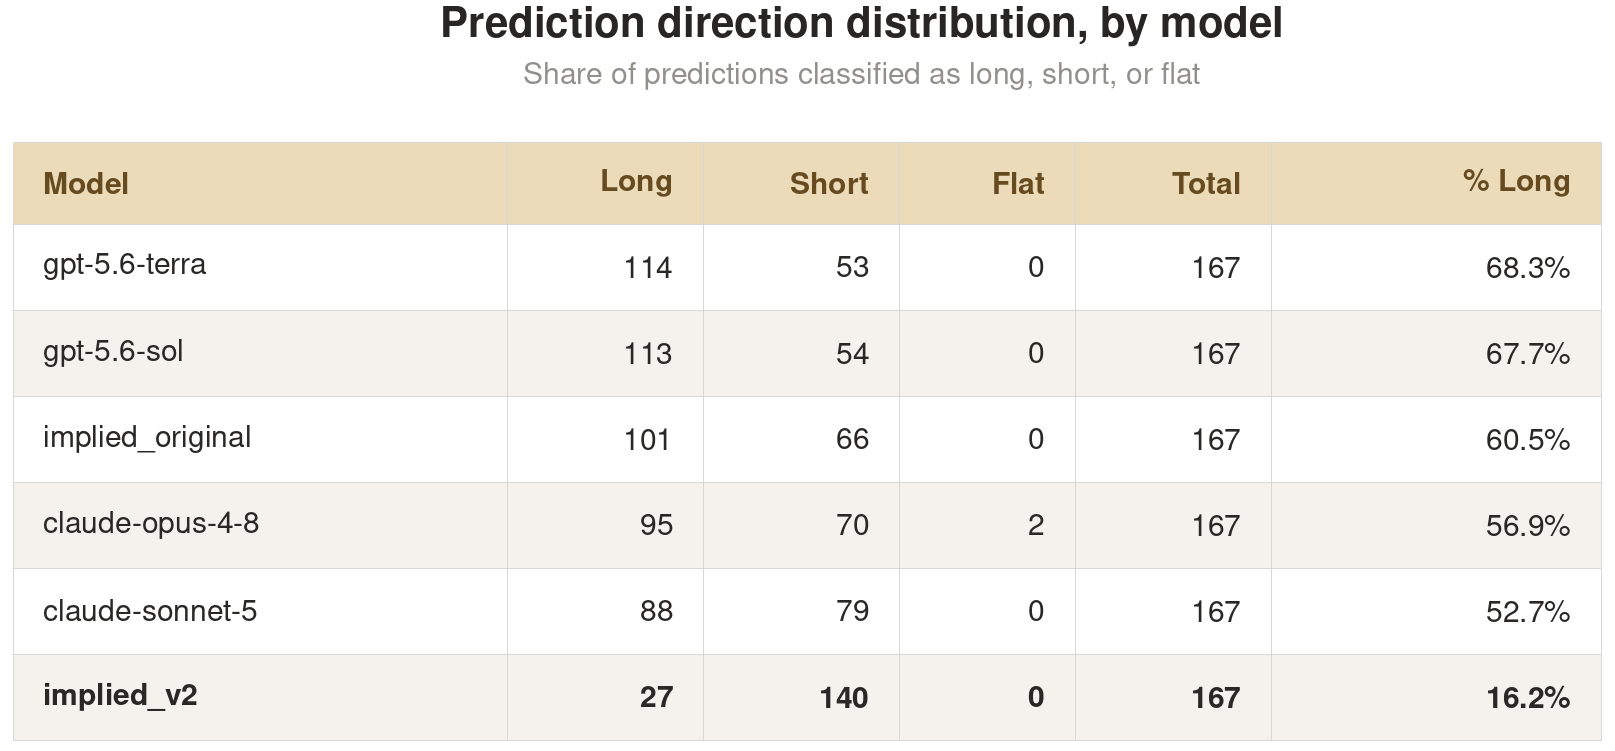
Only 16.2% of Implied V2’s predictions were positive, compared with 52.7% to 68.3% for every other model. We spot-checked several predictions and did not find an obvious systematic explanation for the skew. It may reflect the additional reasoning layer placing greater weight on downside risks, but we do not yet have enough evidence to say.
Rather than adjusting the system during the experiment, we plan to conduct a deeper review once the full earnings season results are available.
What We Plan to Change Next Week
We are not planning any major changes for Week 4.
The models will continue using the same prompts and methodology, including the requirements introduced last week that every model make an explicit directional call and a specific, falsifiable guidance prediction.
Week 3 belongs to Implied V2, but the results continue to move substantially from one week to the next. We will keep publishing both weekly and cumulative results throughout the remainder of earnings season.
Explore the Full Results
Every company-level prediction and grade is available for review. View the full results here.