Week 4 of earnings has wrapped up, adding another 128 predictions for each model.
Week 4 Direction Accuracy
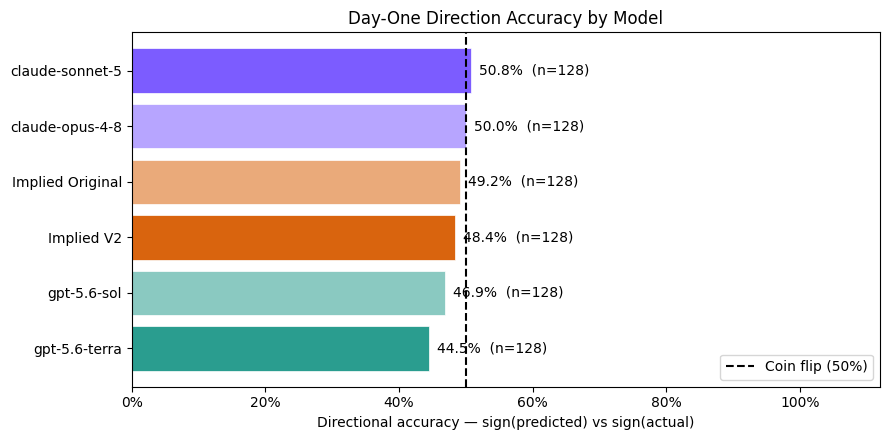
Claude Sonnet 5 led the week, narrowly finishing above the 50% coin-flip line. Claude Opus finished at 50%, while the remaining four models were below it.
Overall, it was a weak week for directional prediction, with relatively little separating the models.
Direction and Magnitude
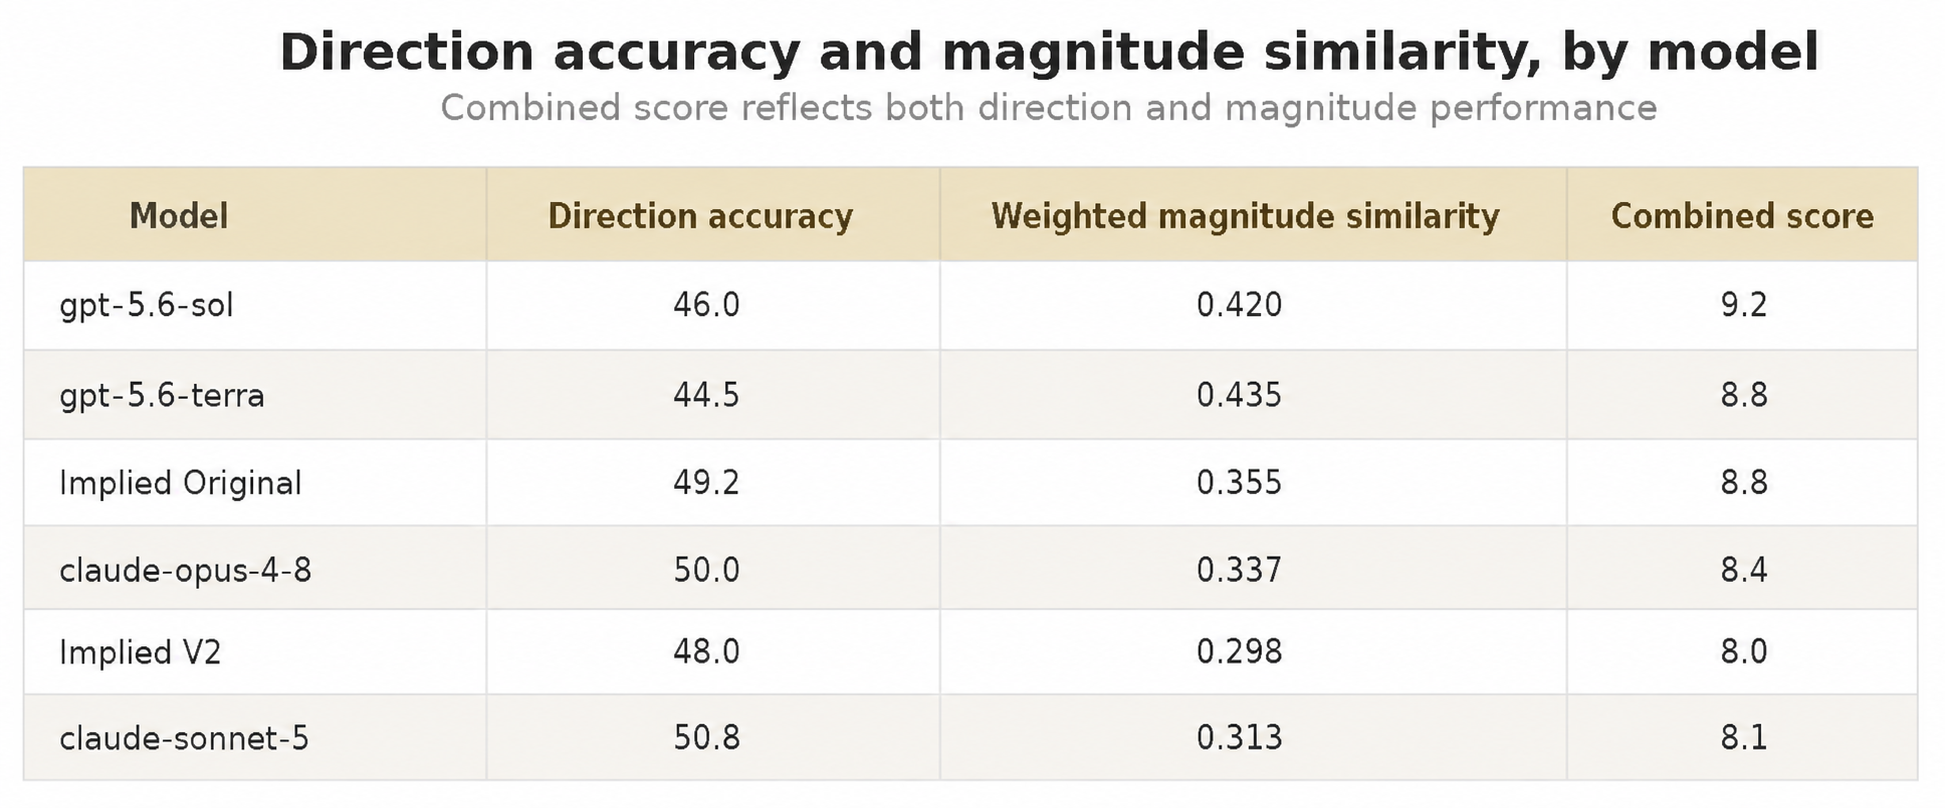
While directional accuracy was tightly grouped, magnitude performance differed much more.
That changed the rankings considerably. Some models with lower directional accuracy produced higher combined scores because they were more accurate on the size of the move when they got the direction right.
This continues to suggest that predicting which way a stock will move and predicting how much it will move are meaningfully different problems.
Predicting Reported Results and Guidance
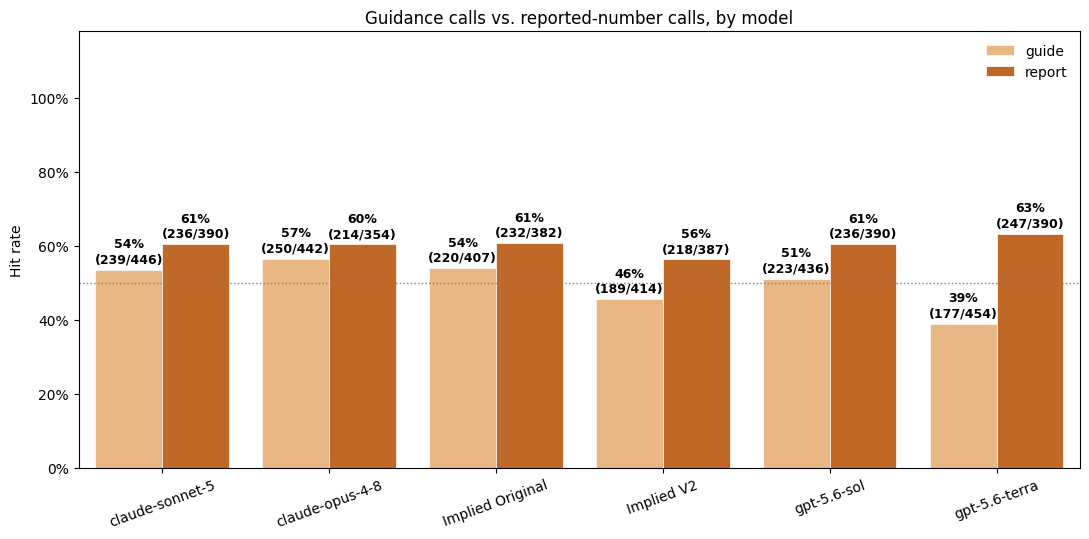
We continue to see little relationship between correctly predicting reported results or guidance and correctly predicting the stock’s direction.
Some models that are relatively strong at predicting what a company will report remain among the weakest at predicting the market reaction.
The distinction is increasingly clear: predicting the earnings themselves and predicting how those earnings compare with expectations, and what investors will actually care about, are different problems.
Cumulative Results
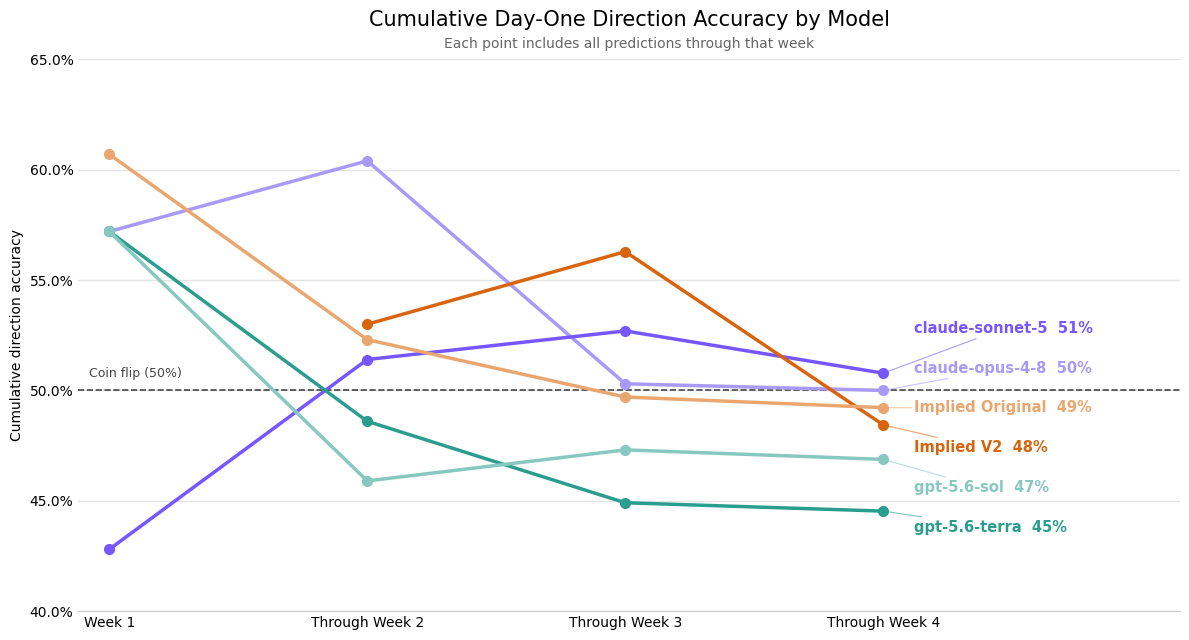
The cumulative results show a broader pattern that is becoming more noticeable: directional accuracy has generally declined as earnings season has progressed.
One possible explanation is that later reporters are harder to predict in isolation. By the time they report, many peers, competitors, suppliers, and customers have already released results. Some information relevant to the company may therefore have already been incorporated into its stock price.
That could leave less new information for the earnings release itself to reveal, making the day-one reaction harder to predict.
There are other possible explanations so we would not draw a firm conclusion yet. But it is one of the more interesting patterns to examine once the full season is complete.
What Stood Out Inside Implied
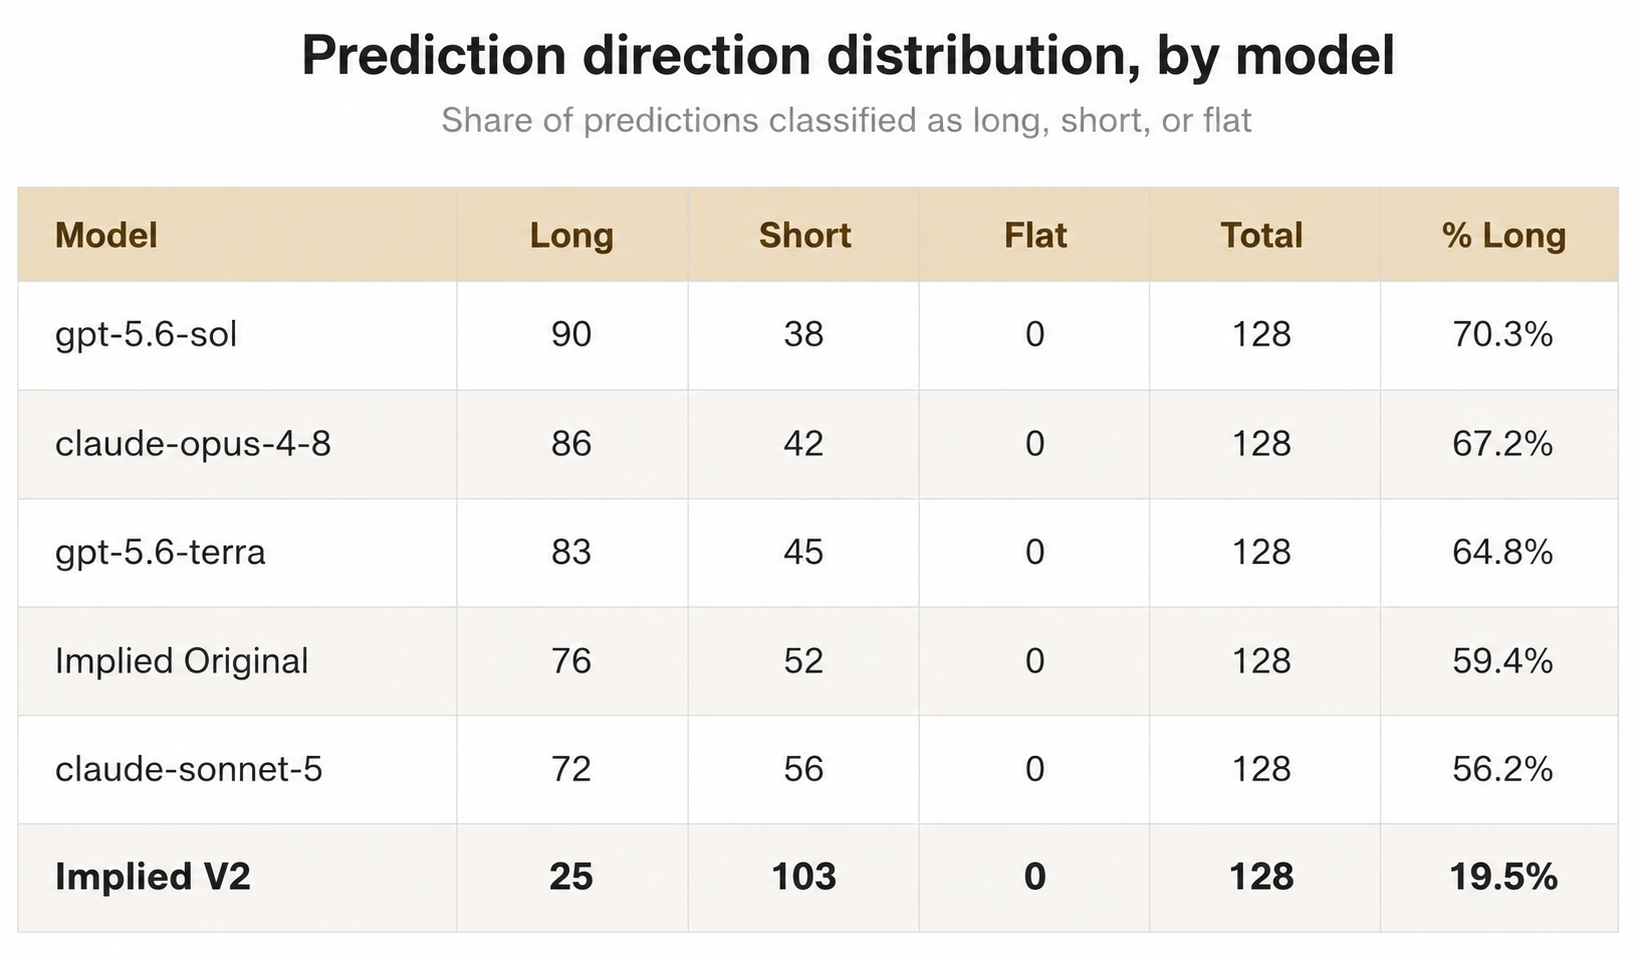
Implied V2’s negative bias continues to be one of the most consistent things we have seen throughout the experiment.
Its predictions remain dramatically more bearish than those of every other model, and the skew has now persisted across multiple weeks. At this point, it looks less like random variation and more like a systematic feature of how the model is reasoning.
We are leaving the system unchanged for the duration of the experiment, but once earnings season is complete, we plan to do a deeper dive into what is driving the bias and whether it is helping or hurting performance.
Explore the Full Results
Every company-level prediction and grade is available for review. View the full results here.