
Last month, we began an experiment to see how well different AI models could predict stock movement after earnings. The setup was fairly simple. The day before an S&P 500 company reported earnings, we had each model create an earnings preview, predict KPIs that would move the stock, and predict the day-one residual return. After the first week, we introduced Implied V2, which added another reasoning layer before making its final prediction. Read more details on the setup in our initial post.
The Overall Result
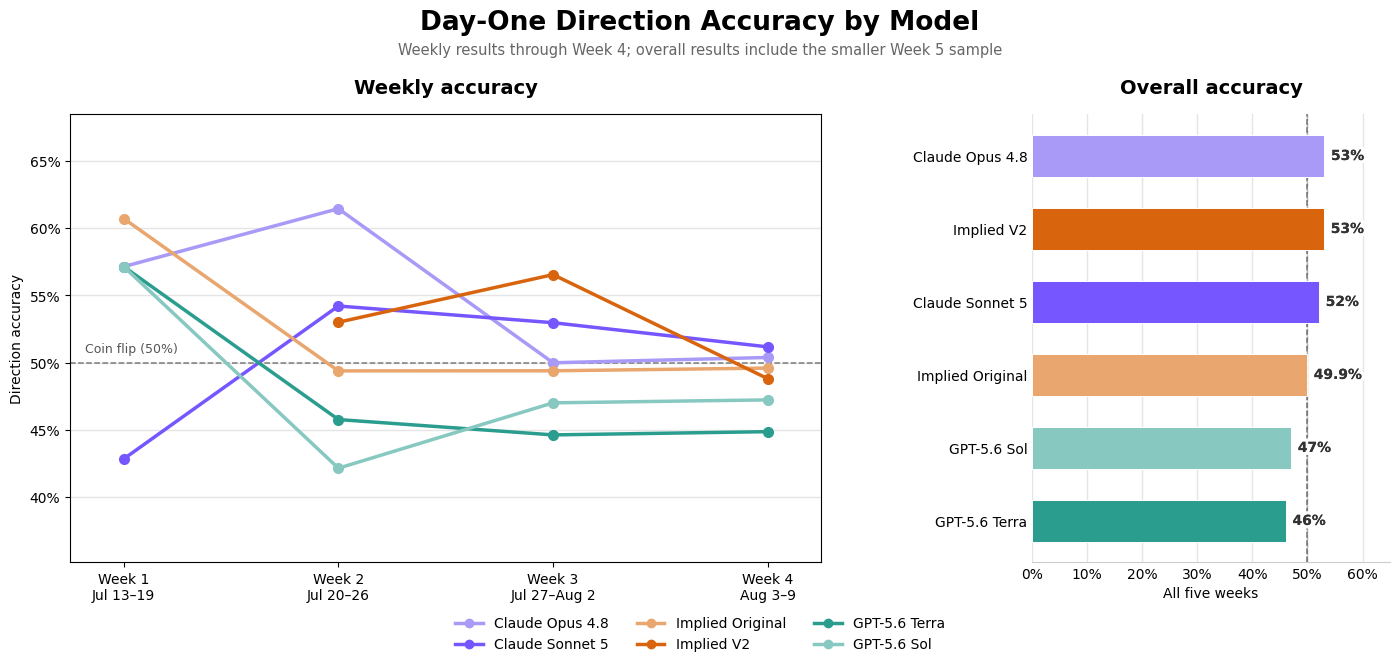
Over five weeks, the experiment covered 415 earnings reports. When any run failed, we removed that observation from every model's results to keep the comparison consistent. Implied V2 and Opus 4.8 tied for the highest directional accuracy at 53%, followed closely by Sonnet 5 at 52% and Implied Original at 49.9%. The GPT models followed an almost identical trend, staying steady over the final three weeks of the experiment to finish at 47% and 48%.
The models finished within four percentage points of 50% in either direction. That is not a large or consistent enough advantage for us to claim that any system reliably beats a coin flip.
The Three Questions
We want to answer three questions. Can any system beat a coin flip on calling earnings outcomes? Does a research process built for investing improve the call? And when Implied studies its misses each Friday, does the following week get better?
To directly answer our initial three questions:
-
Could any system reliably beat a coin flip?
Not in a way we would stand behind. The leading systems finished only a few percentage points above 50%, and none established a decisive advantage.
-
Did the Implied research process improve the call?
Somewhat. Implied V2 improved on Implied Original's direction accuracy after we added another level of reasoning, the only meaningful change we made to the system during the experiment. This suggests more reasoning can help, though V2 did not meaningfully pull away from the strongest base models.
-
Did weekly review improve the following week?
We did not fully test this question. After introducing Implied V2 at the end of week one, we reviewed the misses each week but made no further meaningful changes. As earnings season progressed, accuracy generally declined for all models.
No model showed consistent week-over-week improvement, and most finished below their early-week accuracy. The most likely contributor was the accumulation of information over the course of earnings season. By the time a company reports, its stock may already have reacted to results and commentary from its peers, as well as movements in the broader market. Those read-throughs change both expectations and the setup going into the company's own earnings release.
Our prompts did not explicitly incorporate these season-to-date peer reactions. As more companies reported, the models were therefore working with an increasingly incomplete picture of what the market had already learned and priced in. We think this missing context explains why predictions became less accurate as the season progressed. Broader events, including the Federal Reserve decision in week three and a sharp rotation in momentum stocks, added another layer of difficulty to the one-day price measurement window.
The Models Did Better Predicting Fundamentals
The models performed better when predicting fundamental outcomes than when predicting day-one direction. Implied Original and GPT-5.6 Sol tied for the lead, with 58% accuracy on guidance and 64% on reported KPIs.
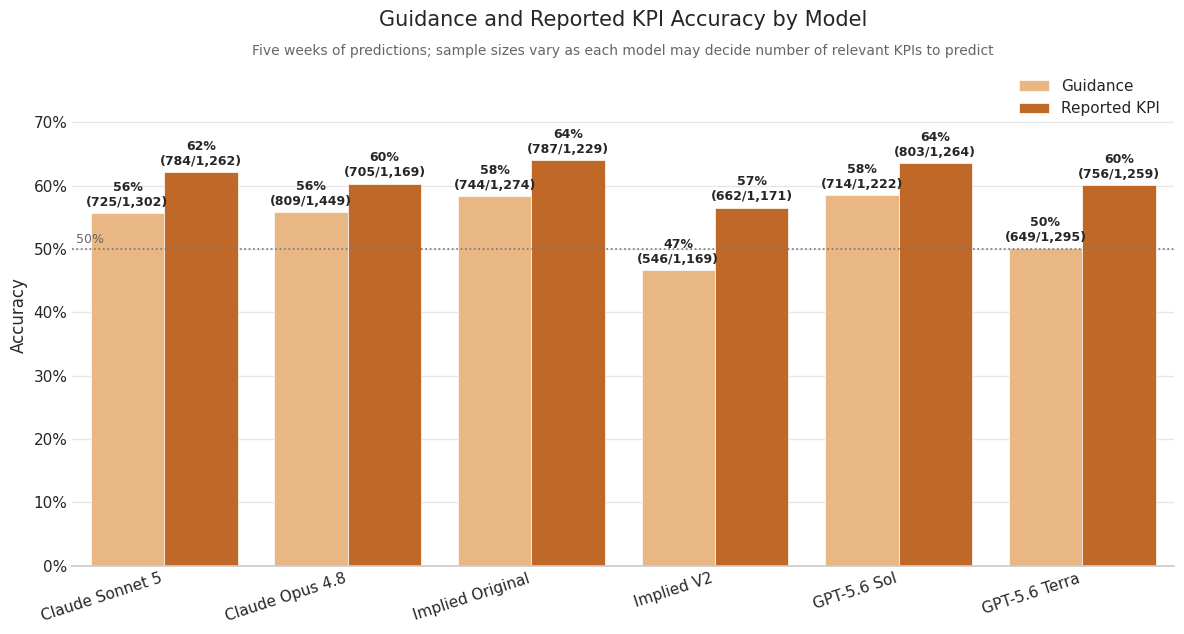
Implied Original performed best on guidance and reported KPIs, while Implied V2 performed better on price direction but worse on fundamentals. The Implied harness is architected to be a fundamental investor's thought partner, so it makes sense it would perform better here. It also suggests that the additional reasoning in V2 changed what the model optimized for.
Implied V2 Developed an 80% Bearish Bias
Since we introduced Implied V2 in the second week of the experiment, it displayed a persistent bearish bias. It made 310 bearish calls across 387 predictions, forecasting a decline 80% of the time.
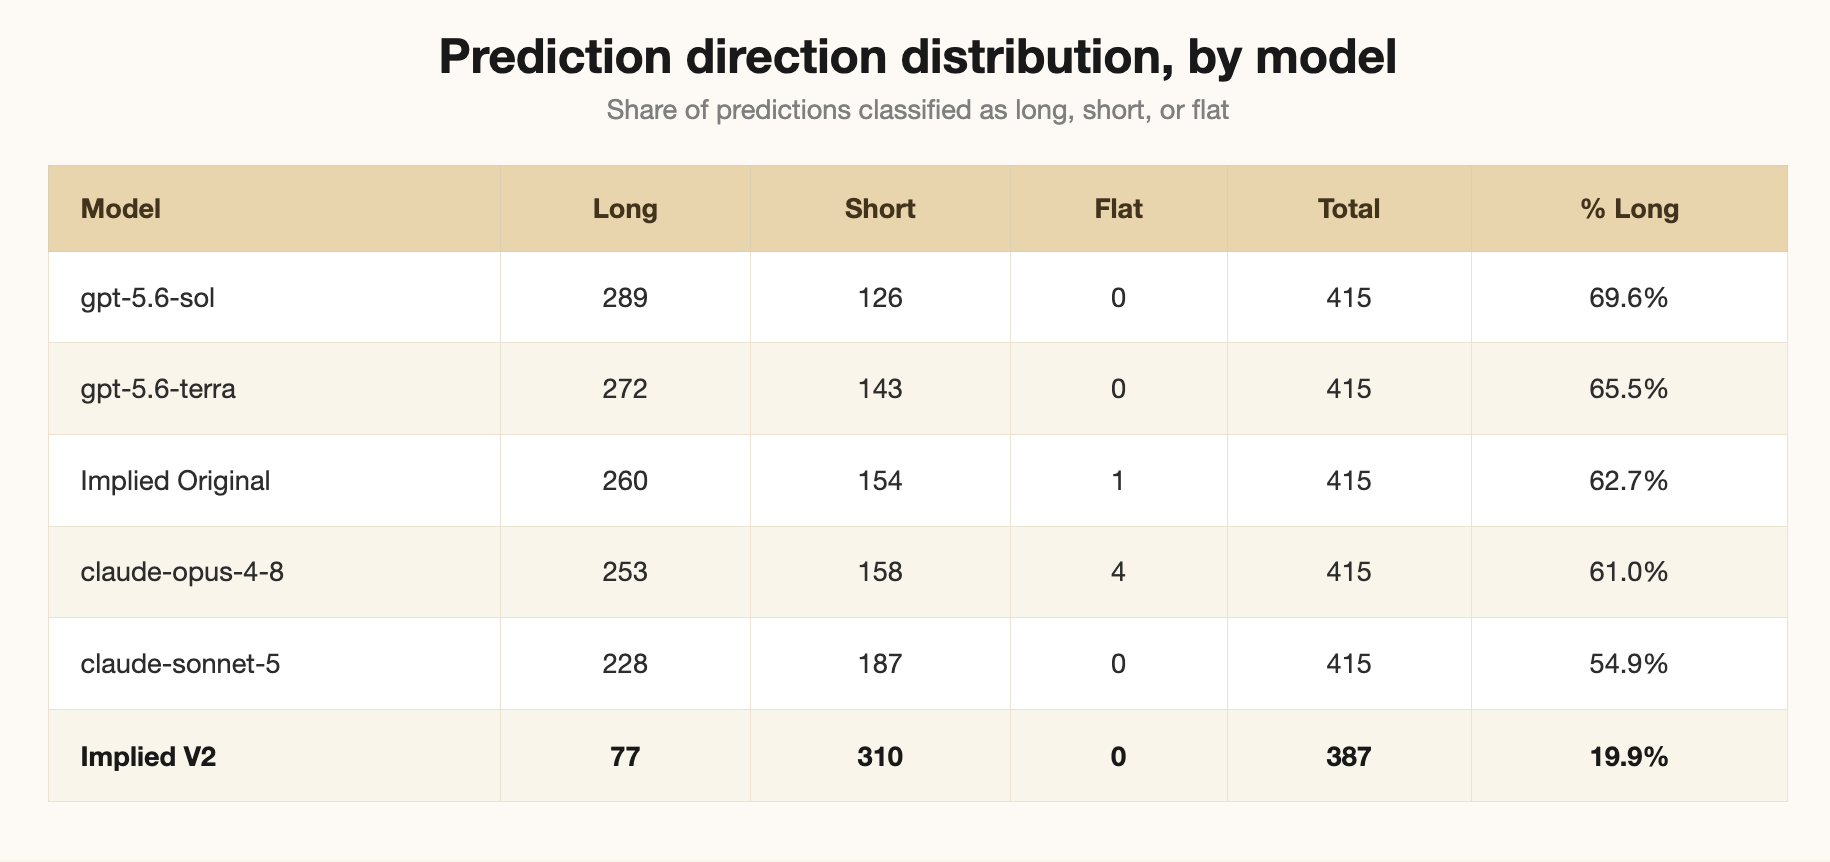
That bias was not entirely arbitrary. Implied V2 places greater weight on a stock's performance leading into earnings, and most of the market was rallying into the print. It interpreted that strength as a difficult setup, reasoning that even solid earnings results would be followed by a fade.
V2 also appeared to apply a stricter standard to the earnings themselves. It was more likely to anticipate a beat without a corresponding guidance raise, a combination it often viewed as insufficient to support the stock after a strong run. Implied Original was generally more lenient in evaluating those setups. Together, those tendencies help explain why V2 repeatedly found reasons to expect downside.
Moves Are Hard to Size
Direction was not the only challenge. Every model also underestimated the magnitude of earnings moves. Depending on the model, the median predicted absolute move was approximately 2.0% to 2.5%, compared with a median actual move of 3.7%. Mean predicted magnitudes ranged from 2.2% to 3.2%, versus a 5.0% mean actual move.
A few models forecast unusually large moves without much success. Opus 4.8 predicted four moves greater than 20%, but in each case, the stock remained essentially flat after earnings. SMCI was a more successful example. The stock rose 18.8% after reporting, and Implied Original came closest with a +12% forecast, while GPT-5.6 Terra predicted a 10% decline.
Actual Versus Predicted Volatility
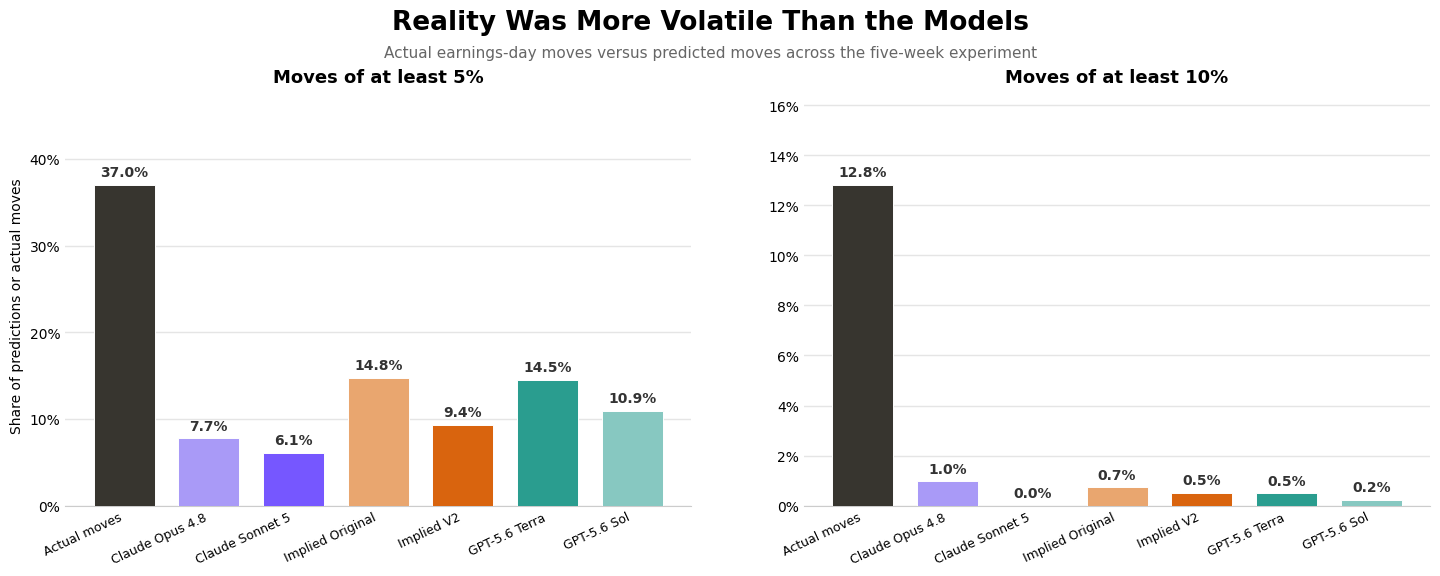
In our initial blog for the experiment, we mentioned that earnings-day volatility has steadily increased over the last 10 years, presenting alpha-generating opportunities for firms able to anticipate the reaction.
We see this pattern in our sample: 37% of stocks moved at least 5% after earnings, and 12.8% moved at least 10%. The models predicted moves of that size far less often.
What Changes Next Quarter
These results suggest that the next version needs more earnings season context, not simply more reasoning. Before each report, we plan to give Implied a clearer picture of how the current earnings season is behaving: how the market is treating small guidance misses, whether large beats are producing sustained rallies or being faded, and how comparable companies in the same sector have reacted.
We also need a better representation of the macro and factor environment surrounding each report. Current news is useful, but recent peer reactions may provide more concrete evidence of how the market is actually pricing similar results. The first experiment did not identify a system that could reliably predict earnings-day stock moves, but it clarified what our approach was missing.